📸 Abbildungen
Hinweis: Stelle sicher, dass die Bilddateien im selben Ordner liegen wie diese HTML-Datei.
Abbildung 1: Versuchsaufbau
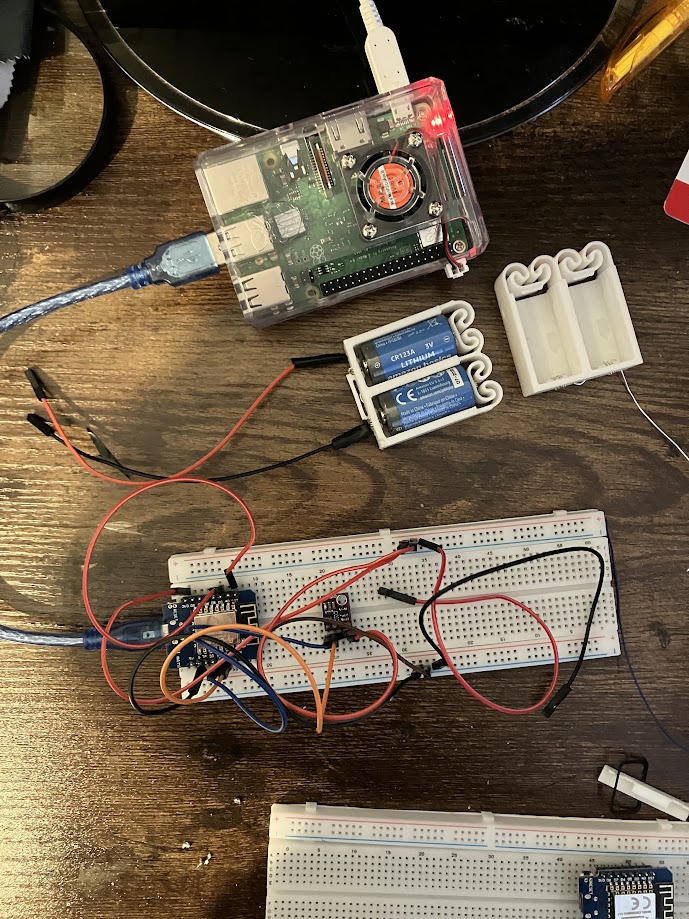
Abbildung 2: Gelötete Platine
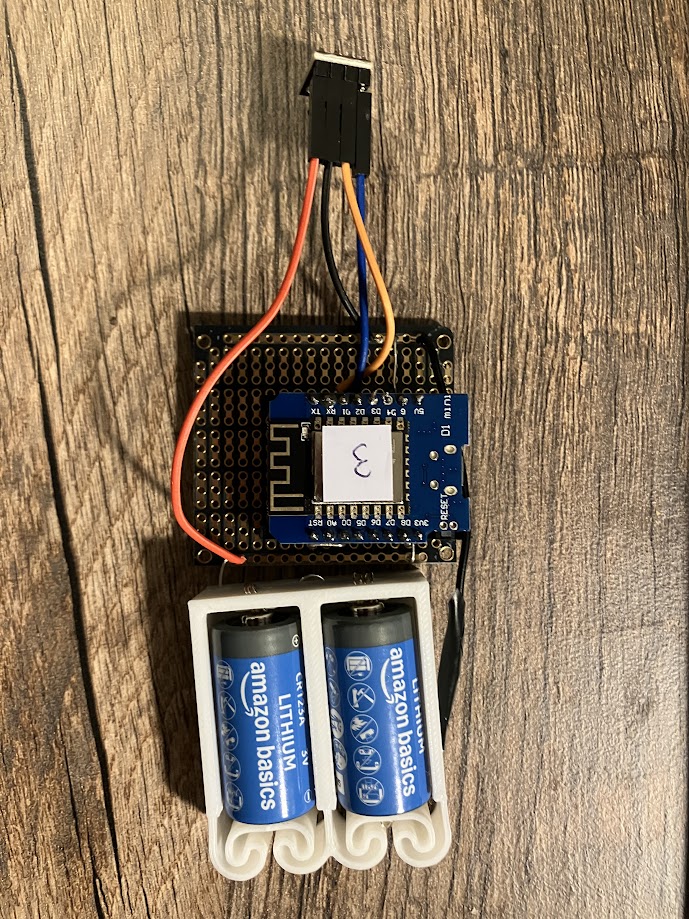
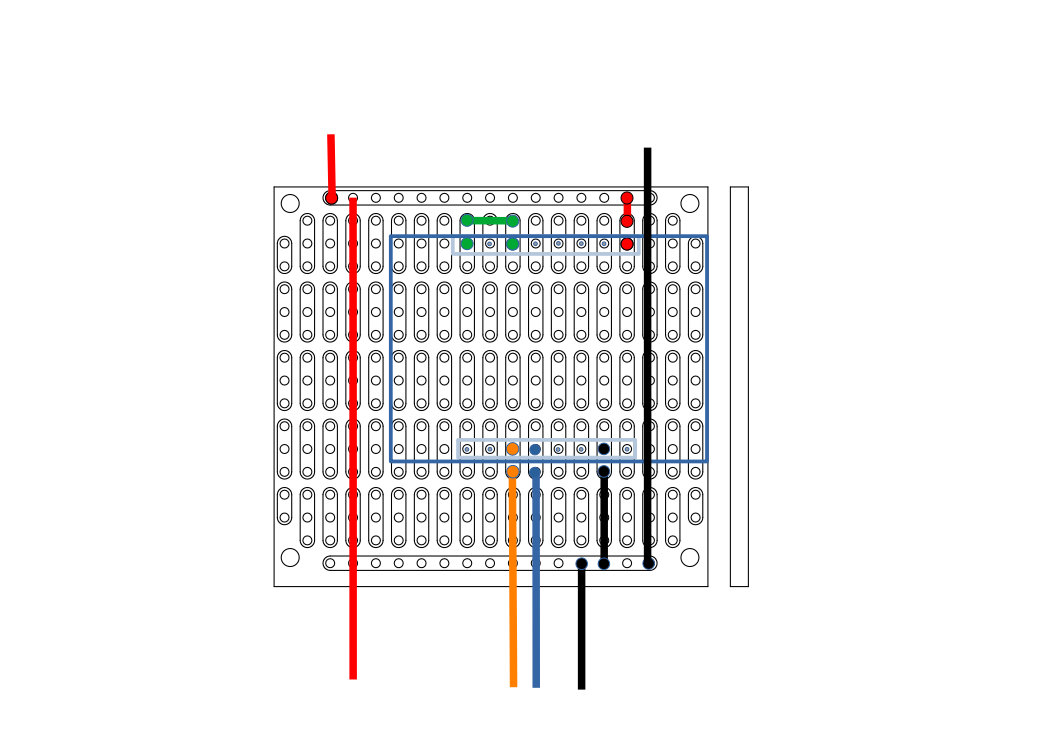
Abbildung 3: Platine Layout
Autor: Peter
Datum: 20. Dezember 2025
Ziel: Autarke Messung von Temperatur, Luftfeuchte und Luftdruck alle 15 Minuten mit CR123A-Batterie + zentrale Datenspeicherung und Visualisierung auf Raspberry Pi.
| BME280 | D1 Mini Lite |
|---|---|
| VCC | 3V3 |
| GND | GND |
| SCL | D1 (GPIO5) |
| SDA | D2 (GPIO4) |
| CSB | 3V3 (für I²C-Modus) |
| SDO | GND (I²C-Adresse 0x76) |
Batterie: CR123A (+) → 3V3, (–) → GND
Hinweis: Stelle sicher, dass die Bilddateien im selben Ordner liegen wie diese HTML-Datei.
Der folgende Sketch ist für den D1 Mini Lite optimiert und nutzt Deep Sleep zur Maximierung der Batterielaufzeit.
#include <ESP8266WiFi.h>
#include <Wire.h>
#include <Adafruit_Sensor.h>
#include <Adafruit_BME280.h>

// ⚠️ ANPASSEN: Sensor-ID (1=außen, 2=WZ, 3=Küche, 4=Bad, 5=Bastelzimmer)
#define SENSOR_ID 3

const char* ssid = "DEIN_WIFI";
const char* password = "DEIN_PASSWORT";

Adafruit_BME280 bme;

void setup() {
  Serial.begin(115200);

  // Brownout-Detektor aktivieren (schützt bei < 2,7 V)
  WRITE_PERI_REG(RTC_CNTL_BROWN_OUT_REG, 1);

  // WLAN verbinden
  WiFi.mode(WIFI_STA);
  WiFi.begin(ssid, password);
  while (WiFi.status() != WL_CONNECTED) {
    delay(500);
  }

  // BME280 initialisieren
  if (!bme.begin(0x76)) {
    ESP.deepSleep(0); // Fehler → dauerhaft schlafen
  }

  bme.setSampling(
    Adafruit_BME280::MODE_FORCED,
    Adafruit_BME280::SAMPLING_X1,
    Adafruit_BME280::SAMPLING_X1,
    Adafruit_BME280::SAMPLING_X1,
    Adafruit_BME280::FILTER_OFF
  );

  bme.takeForcedMeasurement();
  float temp = bme.readTemperature();
  float hum = bme.readHumidity();
  float pres = bme.readPressure() / 100.0; // in hPa

  Serial.print("Temp: "); Serial.print(temp);
  Serial.print(" °C, Feuchte: "); Serial.print(hum);
  Serial.print(" %, Druck: "); Serial.print(pres); Serial.println(" hPa");

  // ⏳ Deep Sleep für 15 Minuten = 900 Sekunden
  ESP.deepSleep(900e6); // 900.000.000 µs
}

void loop() {
  // Wird nie erreicht
}
Hinweis: Die Laufzeit hängt stark von der WLAN-Signalstärke ab.
Das Gehäuse wurde in FreeCAD entworfen und auf einem Ender D1 Max gedruckt. Es besteht aus zwei Teilen: Grundplatte und Deckel. Der Deckel hat Lüftungsschlitze, um eine gute Luftzirkulation für den BME280 zu gewährleisten.
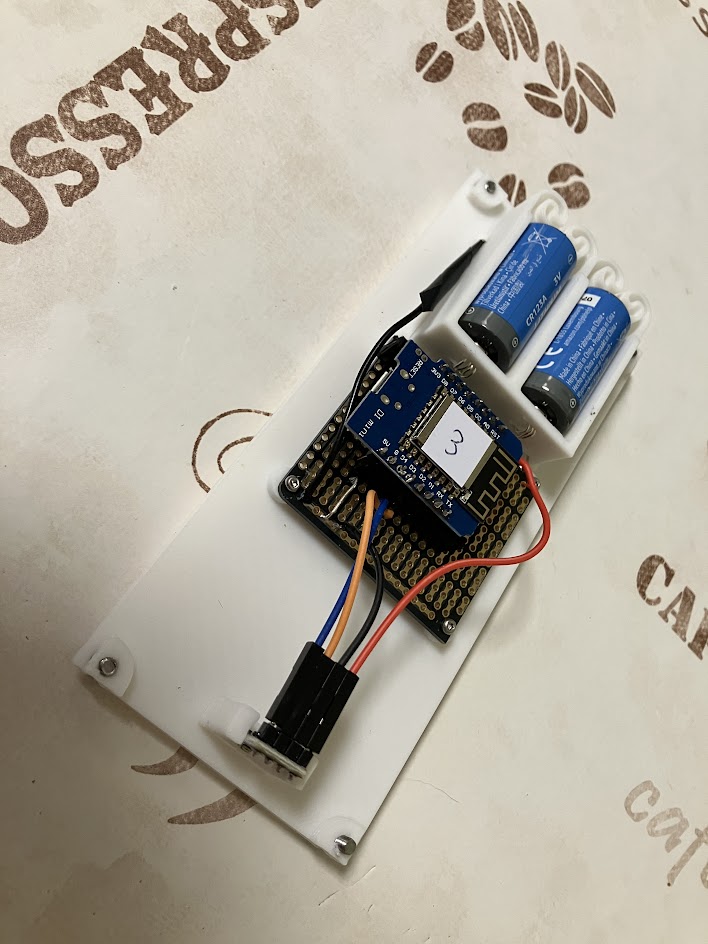
Die Grundplatte beherbergt die Lochrasterplatine mit D1 Mini Lite und BME280. Die CR123A-Batterien sitzen in einem integrierten Halter.
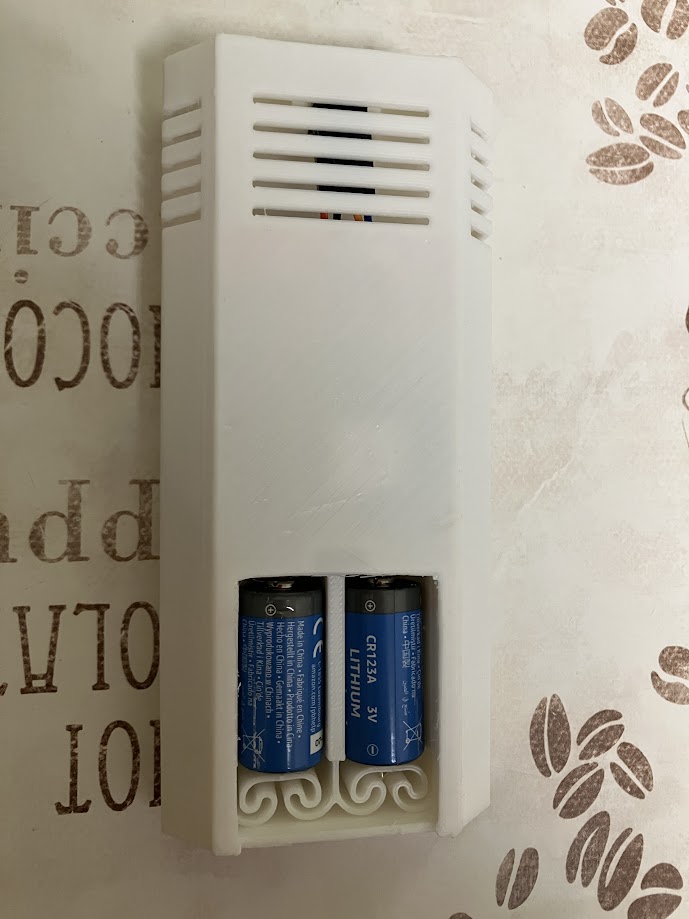
Der Deckel schützt die Elektronik vor Staub und Berührung. Die Lüftungsschlitze sorgen für einen Luftaustausch, während der BME280 die Umgebungstemperatur und -feuchte präzise misst.
Der Raspberry Pi empfängt die Daten per HTTP-POST und speichert sie in einer SQLite-Datenbank. Ein Flask-Webserver stellt die Daten grafisch dar.
sensor-server/
├── app.py
├── config.yaml
├── sensor_data.db
├── static/
│   └── style.css
└── templates/
    └── index.html
#!/usr/bin/env python3
import sqlite3
import math
from datetime import datetime
from zoneinfo import ZoneInfo
from flask import Flask, request, jsonify, render_template
import yaml

app = Flask(__name__)
DB_PATH = 'sensor_data.db'

def load_sensor_names():
    try:
        with open('config.yaml', 'r', encoding='utf-8') as f:
            config = yaml.safe_load(f)
            return config.get('sensor_names', {})
    except FileNotFoundError:
        return {}

def calculate_absolute_humidity(temp_c, rel_hum):
    saturation_vapor_pressure = 6.112 * math.exp((17.67 * temp_c) / (temp_c + 243.5))
    vapor_pressure = saturation_vapor_pressure * (rel_hum / 100.0)
    absolute_humidity = (216.7 * vapor_pressure) / (273.15 + temp_c)
    return absolute_humidity

def init_db():
    with sqlite3.connect(DB_PATH) as conn:
        conn.execute('''
            CREATE TABLE IF NOT EXISTS readings (
                id INTEGER PRIMARY KEY AUTOINCREMENT,
                timestamp TEXT NOT NULL,
                sensor_id INTEGER NOT NULL,
                temperature REAL NOT NULL,
                humidity REAL NOT NULL,
                pressure REAL NOT NULL,
                absolute_humidity REAL NOT NULL
            )
        ''')
        conn.commit()

@app.route('/api/data', methods=['POST'])
def receive_data():
    try:
        data = request.get_json(force=True)
        sensor_id = int(data['sensor_id'])
        temp = float(data['temp'])
        hum = float(data['hum'])
        pres = float(data['pres'])
    except (KeyError, ValueError, TypeError):
        return jsonify({"error": "Invalid data"}), 400

    abs_hum = calculate_absolute_humidity(temp, hum)
    berlin_tz = ZoneInfo("Europe/Berlin")
    timestamp = datetime.now(berlin_tz).isoformat()

    with sqlite3.connect(DB_PATH) as conn:
        conn.execute(
            '''INSERT INTO readings
               (timestamp, sensor_id, temperature, humidity, pressure, absolute_humidity)
               VALUES (?, ?, ?, ?, ?, ?)''',
            (timestamp, sensor_id, temp, hum, pres, abs_hum)
        )
        conn.commit()

    return jsonify({"status": "ok"}), 200

def get_latest_readings():
    with sqlite3.connect(DB_PATH) as conn:
        conn.row_factory = sqlite3.Row
        sensor_ids = conn.execute("SELECT DISTINCT sensor_id FROM readings").fetchall()
        grouped = {}
        for sid_row in sensor_ids:
            sid = sid_row['sensor_id']
            rows = conn.execute(
                '''SELECT * FROM readings
                   WHERE sensor_id = ?
                   ORDER BY timestamp DESC
                   LIMIT 100''', (sid,)
            ).fetchall()
            grouped[sid] = [dict(row) for row in reversed(rows)]
        return grouped

@app.route('/')
def index():
    readings = get_latest_readings()
    sensor_names = load_sensor_names()
    return render_template('index.html', readings=readings, sensor_names=sensor_names)

if __name__ == '__main__':
    init_db()
    app.run(host='0.0.0.0', port=8080, debug=False)
sensor_names:
  1: "außen"
  2: "Wohnzimmer"
  3: "Küche"
  4: "Bad"
  5: "Bastelzimmer"
body {
  font-family: Arial, sans-serif;
  margin: 20px;
  background: #f9f9f9;
}
h1, h2 {
  color: #333;
}
.sensor {
  background: white;
  padding: 12px;
  border-radius: 6px;
  box-shadow: 0 1px 4px rgba(0,0,0,0.1);
  margin-bottom: 15px;
}
.chart-container {
  background: white;
  padding: 10px;
  border-radius: 6px;
  box-shadow: 0 1px 4px rgba(0,0,0,0.1);
  margin-bottom: 30px;
}
<!DOCTYPE html>
<html>
<head>
  <meta charset="UTF-8">
  <title>Sensordaten – ESP8266 + BME280</title>
  <link rel="stylesheet" href="/static/style.css">
  <script src="https://cdn.jsdelivr.net/npm/chart.js"></script>
</head>
<body>
  <h1>Sensordaten – ESP8266 + BME280</h1>

  {% for sensor_id, data_list in readings.items() %}
    {% set room_name = sensor_names.get(sensor_id, "Sensor " ~ sensor_id) %}
    <h2>{{ room_name }}</h2>

    {% if data_list %}
      <div class="sensor">
        <p>🌡️ Temperatur: <strong>{{ "%.1f"|format(data_list[-1].temperature) }} °C</strong></p>
        <p>💧 Rel. Feuchte: <strong>{{ "%.1f"|format(data_list[-1].humidity) }} %</strong></p>
        <p>💧 Abs. Feuchte: <strong>{{ "%.2f"|format(data_list[-1].absolute_humidity) }} g/m³</strong></p>
        <p>📉 Luftdruck: <strong>{{ "%.1f"|format(data_list[-1].pressure) }} hPa</strong></p>
        <p>🕒 Letzte Messung: {{ data_list[-1].timestamp.split('+')[0].replace('T', ' ') }}</p>
      </div>

      <div class="chart-container">
        <canvas id="chart{{ sensor_id }}" height="150"></canvas>
      </div>

      <script>
        document.addEventListener('DOMContentLoaded', function() {
          const ctx = document.getElementById('chart{{ sensor_id }}').getContext('2d');

          const labels = {{ data_list | map(attribute='timestamp') | list | tojson }};
          const temps = {{ data_list | map(attribute='temperature') | list | tojson }};
          const hums = {{ data_list | map(attribute='humidity') | list | tojson }};
          const abshums = {{ data_list | map(attribute='absolute_humidity') | list | tojson }};

          const formattedLabels = labels.map(t => {
            const dt = new Date(t);
            return dt.toLocaleString('de-DE', {
              day: '2-digit',
              month: '2-digit',
              year: 'numeric',
              hour: '2-digit',
              minute: '2-digit'
            });
          });

          new Chart(ctx, {
            type: 'line',
             {
              labels: formattedLabels,
              datasets: [
                {
                  label: 'Temperatur (°C)',
                   temps,
                  borderColor: '#ff6384',
                  backgroundColor: 'rgba(255, 99, 132, 0.2)',
                  tension: 0.1,
                  yAxisID: 'y'
                },
                {
                  label: 'Rel. Feuchte (%)',
                   hums,
                  borderColor: '#36a2eb',
                  backgroundColor: 'rgba(54, 162, 235, 0.2)',
                  tension: 0.1,
                  yAxisID: 'y1'
                },
                {
                  label: 'Abs. Feuchte (g/m³)',
                  data: abshums,
                  borderColor: '#4bc0c0',
                  backgroundColor: 'rgba(75, 192, 192, 0.2)',
                  tension: 0.1,
                  yAxisID: 'y1'
                }
              ]
            },
            options: {
              responsive: true,
              plugins: {
                legend: {
                  position: 'top',
                },
                tooltip: {
                  mode: 'index',
                  intersect: false,
                }
              },
              scales: {
                x: {
                  display: true,
                  title: {
                    display: true,
                    text: 'Zeit'
                  }
                },
                y: {
                  display: true,
                  title: {
                    display: true,
                    text: 'Temperatur (°C)'
                  },
                  beginAtZero: false
                },
                y1: {
                  display: true,
                  position: 'right',
                  title: {
                    display: true,
                    text: 'Feuchte (%) / g/m³'
                  },
                  grid: {
                    drawOnChartArea: false
                  }
                }
              }
            }
          });
        });
      </script>
    {% else %}
      <p>Keine Daten für {{ room_name }}.</p>
    {% endif %}
  {% endfor %}
</body>
</html>
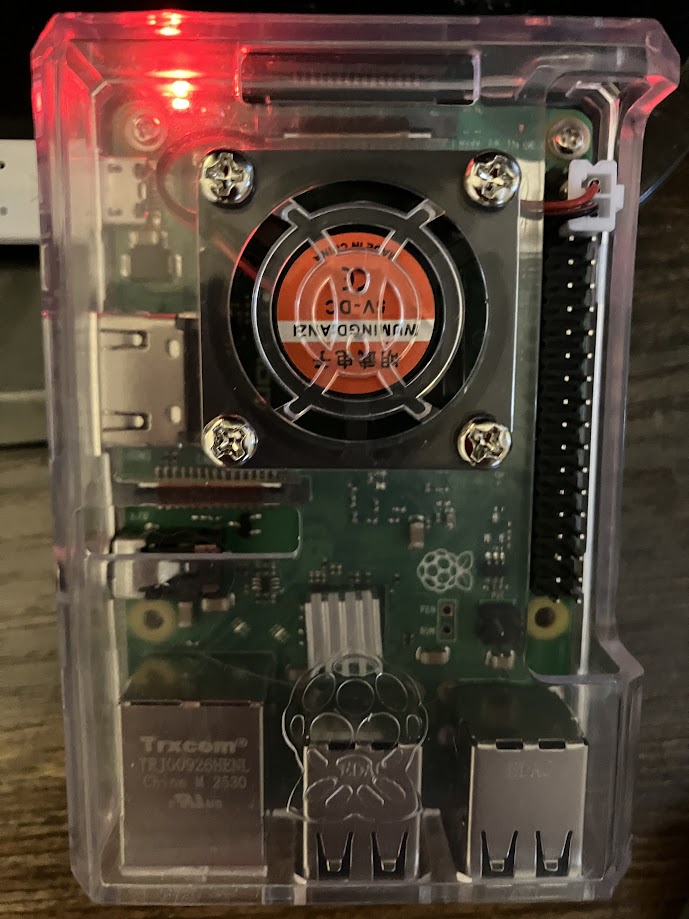
Der Raspberry Pi läuft mit Raspberry Pi OS und hostet den Flask-Server. Er ist mit einem kleinen Kühlkörper und Lüfter ausgestattet.

Das Webinterface zeigt die aktuellen Messwerte und Diagramme für Temperatur, relative und absolute Feuchte. Jeder Raum wird mit seinem Namen angezeigt.
app.pyconfig.yamlstatic/style.csstemplates/index.htmlsensor_data.db:/etc/systemd/system/sensor-server.service:[Unit] Description=Sensor Server After=network.target [Service] User=peter WorkingDirectory=/home/peter/sensor-server ExecStart=/home/peter/sensor-server/venv/bin/python app.py Restart=always [Install] WantedBy=multi-user.targetDann aktiviere den Service:
http://[PI-IP]:8080
Die gesamte Programmierung erfolgte durch Qwen AI